
William Hobbs, Siana Wong, and Jennifer Wolfe; Environmental Assessment Program, Washington State Department of Ecology
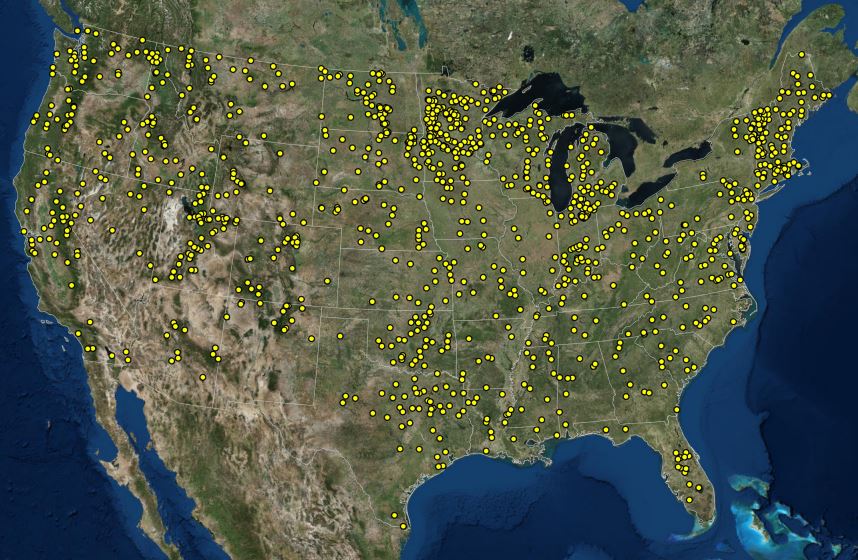
Figure 1: Map showing all sample lakes in the 2012 National Lakes Assessment. Taken from USEPA. 2016. National Lakes Assessment 2012: A Collaborative Survey of Lakes in the United States. EPA 841-R-16-113. U.S. Environmental Protection Agency, Washington, DC. https://nationallakesassessment.epa.gov/.
Recently the U.S. Environmental Protection Agency (EPA) released the results of the 2012 National Lakes Assessment[1]. Begun in 2007 and occurring on a five-year cycle, the assessments are intended to help citizens and governments measure the health of our waters, act to prevent pollution, and evaluate the effectiveness of protection and restoration efforts. The surveys are designed to estimate the percentage of lakes that are in good, fair, or poor condition by examining a large suite of ecological, water quality, and recreational condition indicators. Figure 1 shows the distribution of the 905 lakes assessed across the country in 2012.
The National Lakes Assessment uses a probability design, like a public opinion poll. Sample lakes are selected randomly to represent the population of lakes in their ecological region – the geographic area in which climate and ecological features are similar. The data collected at these lakes are used to draw inferences about a greater target population of lakes. The condition of the lakes is evaluated by comparing results against a set of reference lakes, which represent the least-disturbed condition, or by comparing results to existing metrics such as water quality standards. The survey begins when lakes stratify in the spring/summer and ends at fall turnover, allowing for a limnologically comparable sample period among the study lakes.

Hidden Lake, North Cascades National Park. Photo by S. Wong.
In 2012, the EPA found that 40% of the nation’s lakes had levels of phosphorus above the reference lakes, and 35% had nitrogen levels above reference lakes. Excess nutrients can lead to deteriorating water quality by promoting algal blooms. While 39% of the lakes had detectable levels of microcystin, the algal toxin produced by some cyanobacteria (AKA blue-green algae), levels were rarely a cause for concern relative to World Health Organization guidelines. The survey also found that nutrient pollution was associated with a degraded macroinvertebrate and zooplankton community, suggesting that nutrient pollution could impact lake food webs. EPA found little change in 2012 from the 2007 survey, except for a decrease in the number of lakes with low nutrient levels (oligotrophic), reflecting an increase in median phosphorus levels in lakes.
It’s now 2017, and the third NLA survey is scheduled to begin this summer. As with the previous two surveys, Ecology will sample 31 lakes in partnership with EPA to contribute to the national survey. In addition, we will sample a smaller set of parameters on an additional 19 lakes to increase our ability to describe lake quality in Washington with a known statistical confidence.
Given that Ecology has not had a lake monitoring program since the late 1990s, participation in the NLA (coupled with additional data collection) will provide meaningful data that will contribute to current knowledge of Washington lakes. We hope that this year’s NLA survey helps demonstrate the importance of limnology and lake protection to Washington.
[1] https://www.epa.gov/national-aquatic-resource-surveys/nla