By Curtis DeGasperi, King County Water and Land Resources Division and Will Hobbs, Washington State Department of Ecology
We monitor water quality over time to identify trends and relate them to changes due to human activity. However, water quality monitoring data often don’t go back far enough in time because monitoring doesn’t typically begin before potential human impacts are identified. Furthermore, trends caused by natural variability in these relatively short records can be mistaken for human-caused trends. Lake sediments provide a layered history that integrates the changes in inputs from the water and airsheds that can be consulted at any time using a consistent set of methods [For example, see this June 2022 WATERLINE article]. We conducted a sediment coring pilot study in Lake Washington to assess the potential utility of this approach in evaluating water quality trends and detecting human-caused changes.
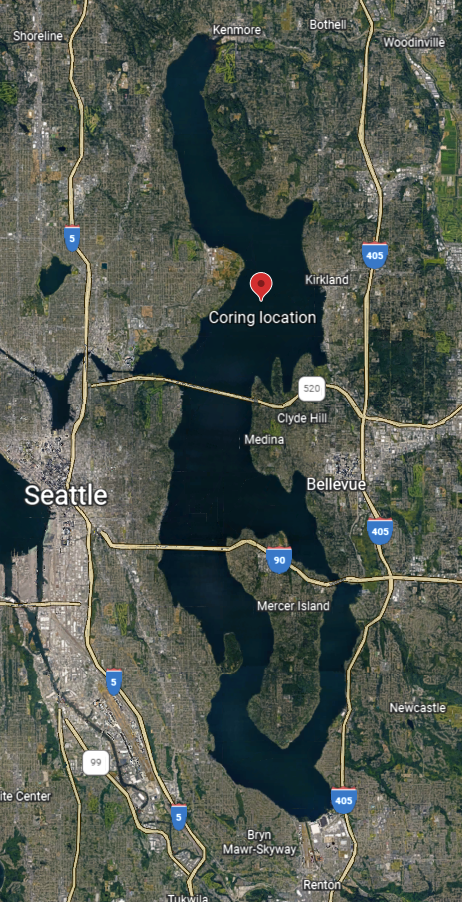
Fig. 1. Location in Lake Washington where the sediment core was collected in 2020 (credit: Google Earth).
Lake Washington, located between Seattle and Bellevue, is the second-largest natural lake in the State of Washington. It is also perhaps one of the most famous case studies of lake eutrophication and subsequent recovery following the diversion of treated wastewater inputs in the 1960s. The lake has been the subject of numerous sediment coring studies focused on the lake’s response to eutrophication and contaminant inputs.
We collected a sediment core from Lake Washington in 2020 (Figure 1). We collected the sediment from 1-cm sections of the core from the surface (0-1 cm) to the bottom of the core (39-40 cm), which represented present conditions (surface sediment) to conditions prior to significant forest clearing and human development of the lake basin (<1860) (Figure 2). The questions we wanted to answer were:

Fig. 2. Photo of 40-cm sediment core collected from Lake Washington in 2020 and the approximate age of the sediment.
What can the collection and analysis of an age-dated sediment core from Lake Washington tell us about long-term trends in nutrients, algae (including blue-green algae or cyanobacteria), and cyanotoxins?
What can the collection and analysis of an age-dated sediment core from Lake Washington tell us about long-term trends and recovery rates due to historical trace metal and synthetic organic inputs?
To answer these questions we measured sediment phosphorus, nitrogen, organic carbon, stable isotopes of carbon and nitrogen, cyanotoxins (microcystins), and fossil algae and cyanobacteria pigments. We also measured metals (aluminum, arsenic, cadmium, chromium, copper, iron, lead, nickel, manganese, mercury, and zinc) and polychlorinated biphenyls (PCBs).
Because there has been a long history of similar studies of Lake Washington sediments, we could compare our results to those reported in earlier studies. In general, the results were very similar across studies, indicating the reproducibility and reliability of these methods for tracking water quality trends. Overall, this pilot study demonstrated the utility of collecting and analyzing a core using consistent methods. The result was a time series of relevant environmental variables spanning more than 150 years.
Some significant findings included:
Eutrophication
- Sediment phosphorus and fossil pigments tracked the observed water quality response of Lake Washington to the period of eutrophication and subsequent secondary wastewater diversion completed in 1968 (Figure 3).
- We observed relatively low algal toxin production levels with a relatively small but measurable increase in toxin production during the eutrophication period.
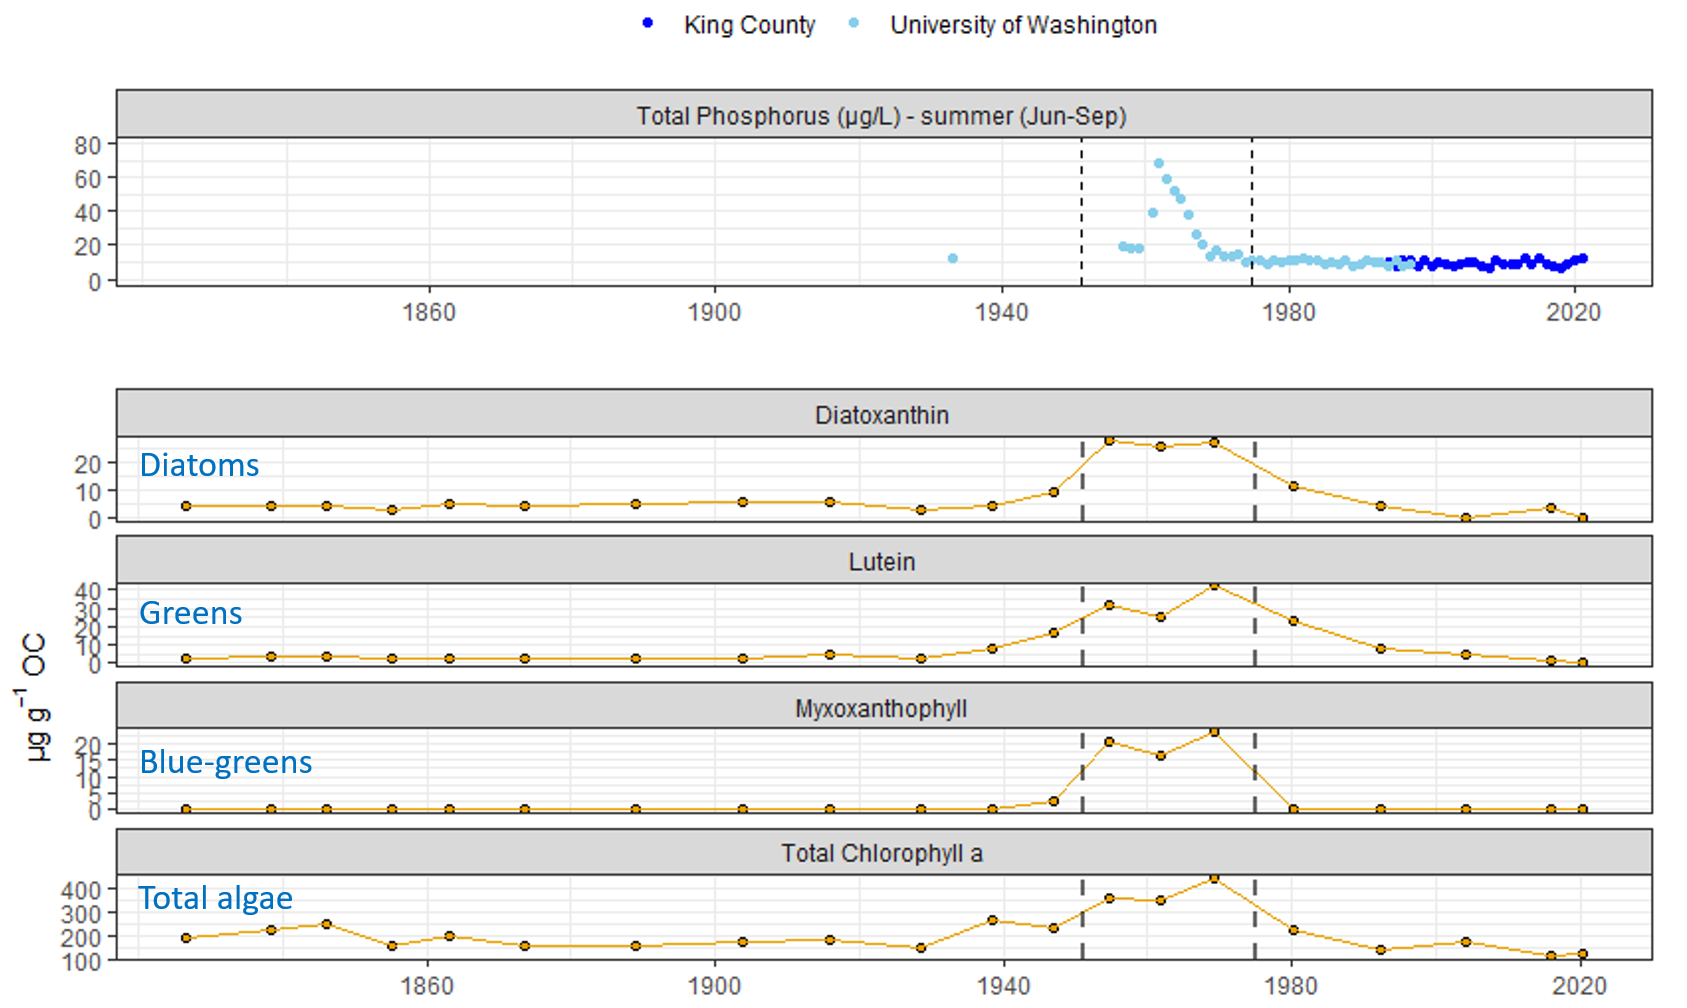
Fig. 3. Panel A shows the observed Lake Washington summer average (June-September) lake surface water total phosphorus concentrations (µg/L) through 2021 [University of Washington data courtesy of Daniel Schindler]. Panel B shows the algae and cyanobacteria (blue-green algae) pigment concentrations in the dated sediment core collected in 2020. The vertical dashed lines represent the breaks between zones determined by hierarchical cluster and broken stick analysis of the sediment pigment data – the area between them shows the period of peak wastewater input and recovery.
- Cadmium, chromium, lead, mercury, and nickel inputs peaked near the middle to the early second half of the 20th century. Inputs of these metals have steadily decreased since their respective peaks.
- Copper and zinc inputs increased through the 20th century until about 1950. Copper inputs appear to have remained steady and zinc inputs have continued to increase since 1950.
- There was a distinct peak in sediment arsenic levels dated to the 1950s. However, there was a secondary arsenic peak in recently deposited surface sediments (0-2cm) that was also observed in the surface sediments of earlier cores from Lake Washington
PCBs
- We observed a rapid increase in sediment PCB concentrations until the 1970s that closely coincided with U.S. PCB production and environmental releases beginning in the 1940s. The sediment concentrations decreased rapidly after the phase-out of U.S. PCB production and its final ban in the 1970s.
A more comprehensive discussion of this work can be found in a recent King County report called Lake Washington 2020 Sediment Coring Study.