
Rachel Fricke, University of Washington Aquatic and Fisheries Sciences
Recent decades have seen a concerted effort to assign value to nature, with the goal of quantifying the benefits human society derives from natural ecosystems. People live and gather around water, and thus one metric for estimating the relative value of lakes to humans is visitation – or the number of people traveling to spend time at lakes, either in the water or on the shore. We refer to these often-intangible benefits humans gain from spending time in natural spaces as “cultural ecosystem services”, abbreviated as CES. Lake-associated CES can include habitat maintenance for species of interest to birders and naturalists, spiritual connection, and many types of recreation such as fishing, swimming, boating, and hiking.
While humans get benefits from our freshwaters, we also pose a significant risk to the integrity of aquatic ecosystems. Human activity – as well as the waste we create – can negatively impact freshwater systems by, for example, depleting habitat quality, altering species’ behaviors, and changing biogeochemical cycles. Anthropogenic (human-caused) changes to ecosystems can also reciprocally limit our access to aquatic resources, and events such as toxic algae blooms may close lakes entirely to public access.
Estimating human activity and associated CES on waterbodies is critical for valuing lake contributions to human society and ensuring the continuation of those benefits. Humans appreciate lakes for a wide variety of reasons, and understanding when, where, and how we are using lakes will enable strategic allocation of funding and amenities to support hotspots of lake-based activity.
Currently, lake visitation is inferred from sparsely conducted in-person or mail-in surveys which often can only capture human behavior over smaller spatial scales, such as a county-wide survey. Furthermore, these data may exhibit timescale biases, as lake users are often only able to accurately report where they’ve visited most recently. In addition, these approaches tend to target specific user groups such as boaters and anglers and fail to holistically capture the wider array of water-based activities.
Social media platforms present a novel opportunity to improve our understanding of waterbody visitation. As citizens of the digital age, we all love using our mobile devices to capture life’s moments, and lake visitors are no exception. Lake users often post about their experiences on social media, and previous work has found that the relative amount and quality of recreational site use is mirrored in posts to social media at cultural and natural points of interest across the globe. Here, we discuss some preliminary results leveraging big data from social media to understand lake use at western Washington waterbodies.
Our first steps in harnessing the power of social media to estimate lake visitation were to assess the capability of social media data to predict on-site visitation and compare the relative contribution of different social media data streams (or platforms) to lake visitation estimates. We acquired data from the photo-sharing platform Flickr, the species ID applications eBird and iNaturalist, the social media platform Twitter, and the activity tracking application Gaia GPS to inform our analyses. Each of these data sources represent somewhat distinct lake user groups pursuing specific CES. For example, Flickr users, who tend to be professional photographers, may be appreciating the aesthetic value of lakes, individuals identifying species via iNaturalist and eBird are both contributing to scientific knowledge and valuing the natural attributes of lake ecosystems, Gaia GPS users are typically engaging in physical activity, and Twitter users may be benefiting from a wide array of CES including recreational activities, cultural heritage, and artistic or spiritual endeavors.
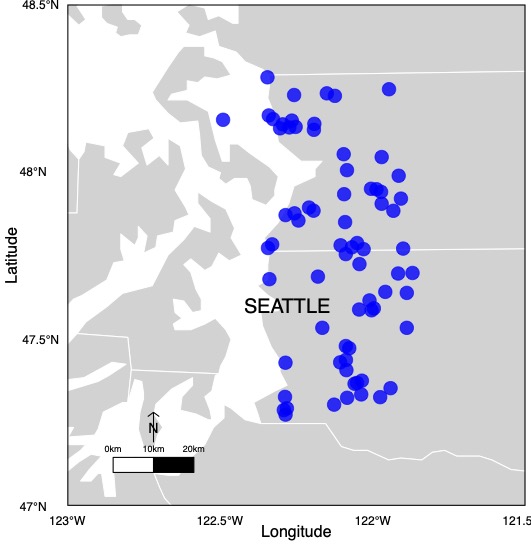
Figure 1. Locations of 70 lakes for which on-site instantaneous counts of human visitation were collected in King and Snohomish Counties.
Our on-site visitation dataset comes from partners at King and Snohomish Counties and consists of instantaneous counts including both on-lake and shoreline visitors for 70 lakes (Fig. 1). The lakes included in this study are largely in suburban neighborhoods, and most have at least one public access point such as a park or boat launch. Counts were collected by volunteers on a monthly or bi-weekly basis May through October from 2015 through 2019. Volunteers counted the number of people who were swimming, angling, boating, and near the lake shoreline during each sampling event.
We started with many points of geotagged posts from social media users acquired through web scraping and data requests. These included photos posted to Flickr, observations recorded in eBird and iNaturalist, Tweets shared over Twitter, and anonymized and lake-aggregated tracks from Gaia GPS. We overlayed post locations obtained from application metadata with lake shapefiles from the USGS National Hydrography dataset. We then excluded locations that didn’t fall within a 50-meter buffer of lake surface polygons for the 70 lakes in our on-site dataset and filtered the data to the same time frame as our on-site observations. This gave us between 2,500 and 7,500 user-days per social media platform.
First, we examined the correlations between mean annual on-site counts as a function of cumulative annual, relatively scaled social media records from each platform. Social media platforms generally reflect on-site visits to lakes, except for eBird which has a correlation coefficient near zero (Fig. 2). Next, we modeled on-site lake visitation as a function of combined social media observations from across all platforms with a random lake effect. Ultimately, we will use this visitation model to predict visitation at lakes lacking on-site visitation. These visitation estimates will inform a revealed preference model analyzing which lake attributes (e.g., size, public amenities, transportation access) drive relative differences in lake use.
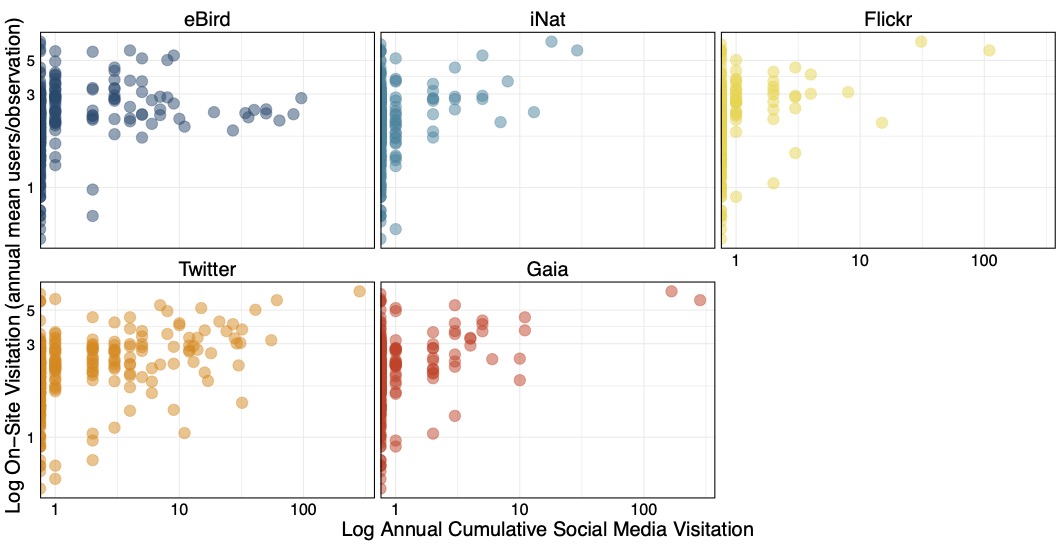
Figure 2. Correlation between log-transformed cumulative social media visitation and log-transformed on-site visitation expressed as annual mean number of users per instantaneous observation. We calculated the Pearson’s correlation coefficient for eBird (r = 0.05), iNaturalist (r = 0.34), Flickr (r = 0.29), Twitter (r = 0.39), and Gaia GPS (r = 0.33).
Our preliminary results suggest that social media posts reflect empirical lake visits, and that some social media platforms are more informative than others for estimating empirical on-site visitation. Though social media platforms like eBird have been strong predictors of on-site use in some previous studies, we think the nature of this set of lakes – largely urban and suburban with dedicated public access – may favor social media platforms with users seeking developed amenities rather than natural areas conducive to activities such as birdwatching. Despite disparities in how strongly social media data sources correlate with on-site visitation, though, it is still valuable to include all data sources because they represent distinct user groups and CES.
Special thanks to the volunteers who have surveyed lakes for King and Snohomish counties over many years, providing the on-site data used in this study.
Email: rmfricke@uw.edu
Twitter: @rmfricke
Rachel Fricke is a graduate student at the University of Washington School of Aquatic and Fishery Sciences advised by Julian Olden, and a 2021 winner of WALPA’s Dave Lamb scholarship.