
by Timothy Clark, Herrera Environmental Consultants, and
Kevin Hansen and Stuart Whitford, Thurston County
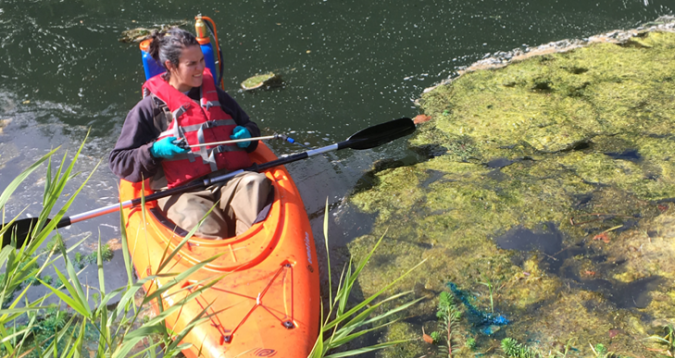
Thurston County staff provide help with monitoring and education about lake ecosystems. Staff teach lakefront residents about the signs and symptoms of an unhealthy lake as well as the best way to manage those issues.
Thurston County has been collecting water quality data in streams, lakes, and other surface waters for years. That long-term monitoring effort has generated a deep and valuable dataset. This dataset supports technical analysis, regulatory compliance, restoration planning, and day-to-day decision making. Thurston County, local cities, and their partners have greatly benefited from this robust water quality database when developing stormwater management action plans, retrofit prioritizations, and lake management plans. I greatly appreciated the historic data on Lake Lawrence as we have been developing a lake cyanobacteria management plan with their lake management district.
While field work and laboratory analyses are filled with their own unique challenges (and rewards!), one of the greatest challenges with environmental data is making it easy to access, interpret, and share.
To bridge that gap, Thurston County partnered with Herrera Environmental Consultants to develop a suite of interactive water quality dashboards. The goal was straightforward: take rigorous scientific monitoring data and present it in a way that’s intuitive, transparent, and useful for both technical staff and decision makers. All without requiring anyone to open a spreadsheet or write code.
The result is a set of web-based dashboards that allow users to explore conditions across the County, visualize trends over time, and quickly understand the state of local waters.
An accessible window into local water conditions
The dashboards are organized around Thurston County’s ongoing monitoring programs and are accessible through the County’s Water Dashboards portal. Separate dashboards focus on streams, lakes, and rainfall/water levels (developed separately).
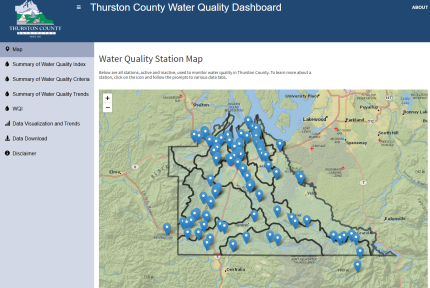
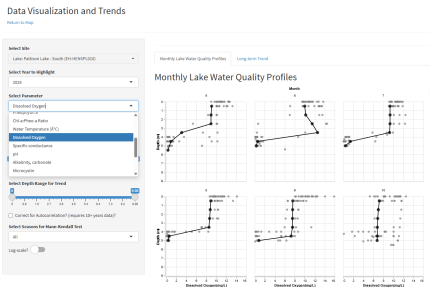
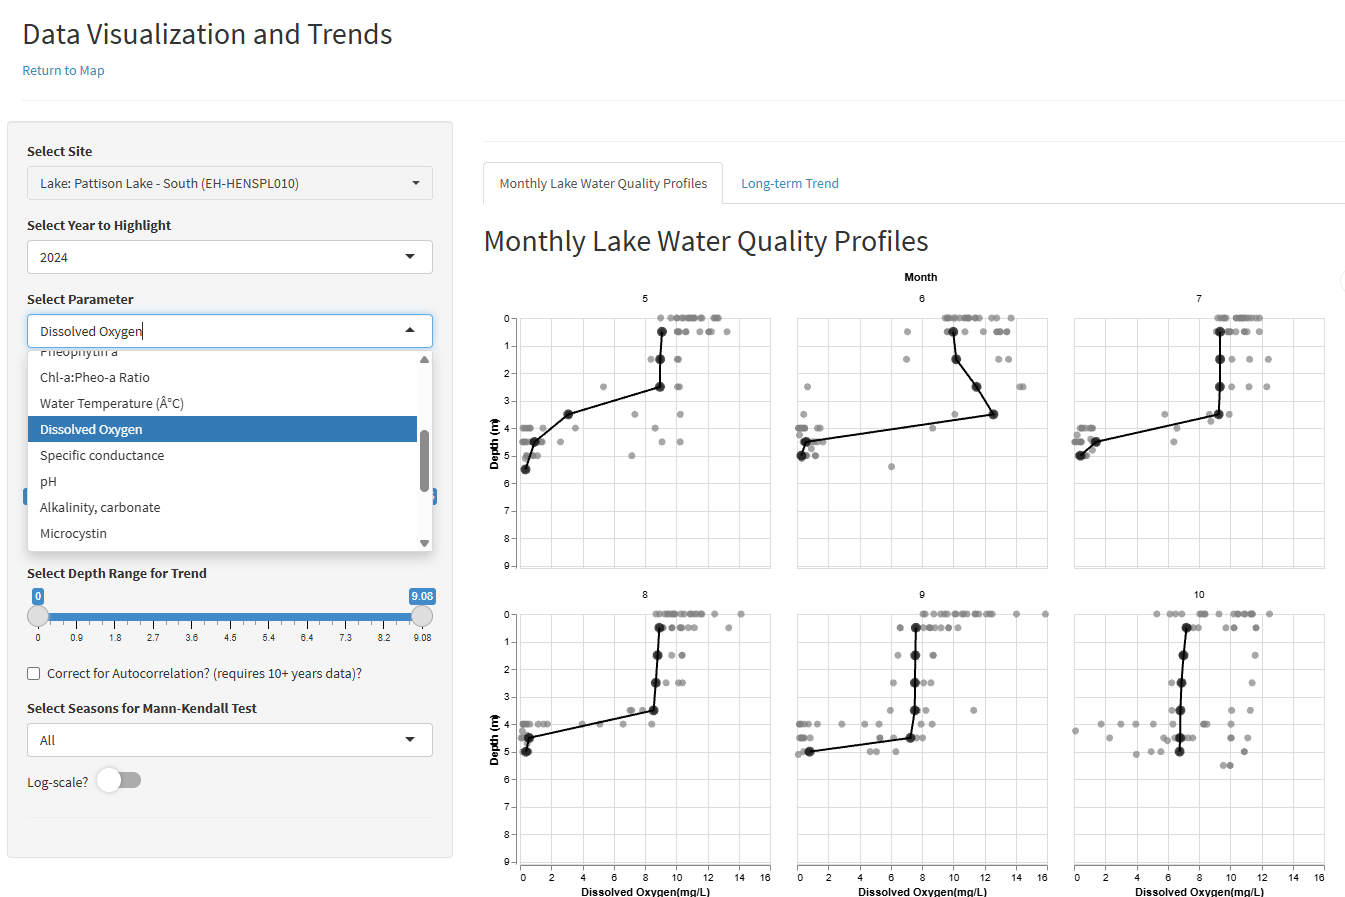
Each dashboard provides interactive maps of monitoring locations across Thurston County. Users can click on individual sites to view parameter-specific data, explore time series plots, and review summary indicators that place current conditions in context. The structure mirrors how water quality professionals think about data: by site, parameter, and across depth and time, while keeping the interface approachable for non-technical users.
The Streams Water Quality Dashboard presents data from monitoring sites across the county’s stream network, and the Lakes Water Quality Dashboard provides access to surface water monitoring information for Thurston County lakes. Users can explore site-specific information and view water quality indicators through interactive charts and maps. The dashboard is designed to support transparency by making monitoring results easy to find and interpret, while still preserving the scientific integrity of the underlying data.
 Science-based design, transparent methods

Herrera developed the dashboards using a reproducible, open-source framework that emphasizes transparency and longterm maintainability. The underlying codebases for the Thurston County Water Quality Dashboards are publicly available, documenting how data are processed and presented. This approach allows methods to be reviewed, updated, and improved over time as monitoring programs evolve.
 Supporting informed decisions and public engagement
Beyond simply displaying data, the dashboards are intended to support informed conversations about water quality in Thurston County. By making monitoring results readily available, the dashboards help residents, local organizations, and decisionmakers better understand current conditions and longterm patterns.
For County staff, the dashboards provide a consistent, centralized way to share information internally and externally. For the public, they offer a clear entry point into complex environmental data, reinforcing trust through openness and clarity. As monitoring continues and datasets grow, the dashboard framework can be expanded to incorporate new information and respond to emerging questions.
 From the field to the dashboard

A key feature of the dashboards is that they are directly connected to the County’s monitoring workflow. Field staff at Thurston County collect samples and field measurements as part of their routine monitoring programs. Samples are sent to accredited laboratories for analysis. Once laboratory results are received, County staff review both the lab results and associated field data for quality control and completeness.
After review, the finalized dataset is uploaded to EPA’s Water Quality Exchange (WQX), the national repository for water quality monitoring data. The dashboards are designed to periodically query the WQX database and retrieve the latest available data for Thurston County monitoring sites. This means:
- There is no manual re-upload of data into the dashboard.
- Updates occur as new, QA-reviewed data are published to WQX.
- The dashboards remain aligned with the authoritative public dataset.
This structure ensures that the dashboards are not a separate or duplicative database; they are a dynamic visualization layer built on top of EPA’s WQX system. As new data are added to WQX, the dashboards automatically reflect those updates during their scheduled refresh cycles.
A model for accessible environmental data
The Thurston County water quality dashboards demonstrate how thoughtful design and clear communication can extend the value of longstanding monitoring programs. By pairing robust scientific data with intuitive, interactive tools, Thurston County and Herrera have created a resource that supports transparency, education, and stewardship of local waters.
To learn more about these dashboards, access the codebase, or discuss your own dreams and desires for a data dashboard, contact Clark at tclark@herrerainc.com .