by Avery Shinneman, Associate Teaching Professor, UW-Bothell
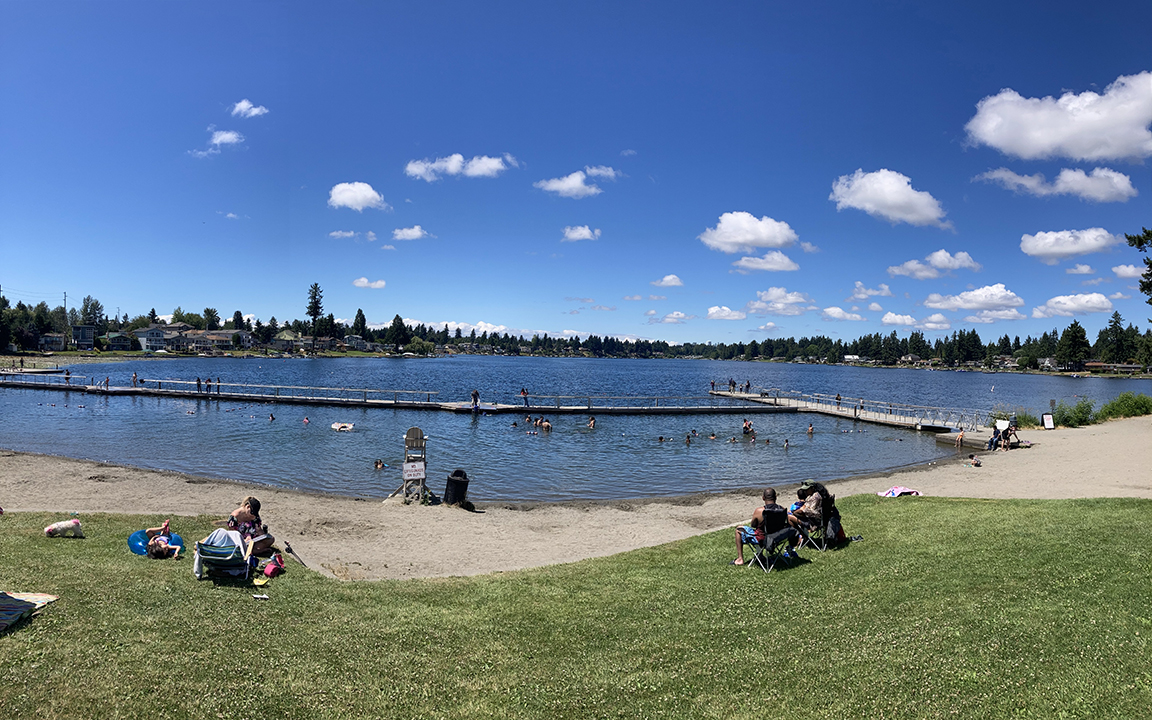
Like many Washington lakes, Lake Meridian is popular with a variety of lake users.
How many people travel to public waterfront parks to picnic on a typical sunny Saturday? Do more people who visit parks with fishing piers use them for fishing or swimming? Would more people visit waterfront parks if they had better evening lighting or more accessible bathrooms?
Answers to questions like these are surprisingly hard to come by. As visits to public recreation areas have increased during COVID-era limitations on indoor activities, as well as during the summer heat waves, it’s increasingly important to understand both the accessibility of lakes and waterfront parks and their uses.
Beginning in May, students, staff, and faculty from all three University of Washington campuses (Tacoma, Seattle, and Bothell) began a pilot survey project with input from King and Snohomish Counties seeking to answer these kinds of questions. We tested a survey and different distribution methods, and hope to scale up the project in the future.
Project partners distributed electronic surveys widely through social media, listservs, and other online communication. At the same time, the team fanned out across 18 lakes in King and Snohomish Counties on a rotating weekday/weekend schedule to visually count visitors using motorized or non-motorized watercraft, swimming or wading, fishing, visiting the shoreline, or using the park nearby for exercise or socializing. Counts are taken at four different times to capture activity throughout the day. Between counting intervals, the team spreads out across the park to survey users directly. Survey questions address primary reasons for visiting the park, frequency of visitation, amenities most used or desired, concerns about using the park or lake, and demographic information. Traffic counters have also been installed at ten of the lakes for a more detailed look at daily use patterns.
The in-person data points collected through visual counts and surveys will be paired with aggregate data from several popular apps that track outdoor recreation, including Strava, iNaturalist, and eBird as well as social media tags from platforms like Facebook and Instagram. Pairing these aggregate data from the targeted lakes with visual counts from the same day may clarify whether social media can be used to estimate lake use in wider geographic areas.
All of these approaches are intended to provide data to agencies that manage waterfront lakes and parks. The data can help staff better understand who is visiting the lakes and for what purpose, as well as assess the match between provided and desired amenities in different locations. By distributing the survey broadly, we also hope to learn how far people are travelling to lakes with desired amenities, and whether there are identifiable populations that do or don’t use certain lakes or parks – and why.
More information on the survey results will be presented at the WALPA 2021 conference, through two undergraduate posters and a graduate student talk. Results will also be shared in a future issue of Waterline. If you live in King County or Snohomish County and haven’t yet taken the survey, please do and share it with your networks as well. The survey can be found at: https://forms.gle/uxFnLsj4jE7HaBii6
If you have questions about this project, please email Avery at alcs@uw.edu or Jim Gawel at jimgawel@uw.edu.