Jeffrey Tepper, Andrew Oberhelman, and Mitchell Dodo
Geology Department, University of Puget Sound

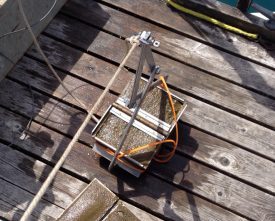
Researchers check the piezometer at Gravelly Lake.
The South Puget Sound region contains over 500 natural lakes, many of which originated as kettles, depressions that formed as buried ice blocks melted during the last glacial retreat. Over the past 14 years, students in Environmental Geochemistry at the University of Puget Sound have been collecting and analyzing water and sediment samples from about a dozen lakes in the Tacoma–Lakewood–Federal Way area. Although these lakes vary in size and depth, all are hosted within similar glacial outwash deposits and are fed by some combination of precipitation, surface runoff, and groundwater inflows, so we initially assumed that their water compositions would be broadly similar. As our data set has grown, however, it has become clear this is not the case: each of the lakes studied has a unique chemical fingerprint that remains similar year to year. This led us to wonder what factors or processes control lake water chemistry, and whether there are also systematic differences in sediment chemistry from one lake to the next. This article summarizes the initial results of two studies conducted this past summer that were designed to answer these questions.
Identifying the Water Sources for a Lake
On plots of lake water composition that depict conservative elements (those not affected in the water column by biological processes or mineral precipitation), the data for each lake form a cluster, and together these clusters define a linear array (Fig. 1). The simplest explanation for this linear trend is that the lakes represent mixtures, in varying proportions, of water from two main sources, one (probably groundwater) containing high concentrations of dissolved species and the other (probably rain or surface runoff) being very dilute.
To test this hypothesis, Andrew Oberhelman (’17) collected 55 samples of groundwater, surface water, and precipitation from sites near Gravelly, Waughop, Steilacoom, Spanaway, Dolloff, and Fenwick Lakes. Groundwater samples included shallow interflow collected with a drive point piezometer and deeper groundwater obtained from wells in the unconfined “A”aquifer (0-250′ deep) and the deeper “C” aquifer (300-500’deep). Each sample was analyzed for major and trace element concentrations and O and H isotope ratios. These data (Fig. 2) were then used in mass balance calculations to evaluate whether the lake waters could be modeled as mixtures of these potential water sources, and if so, in what proportions.
Initial results support a mixing model, with proportions ranging from ~70% groundwater: ~20% interflow: ~10% precipitation at Gravelly Lake to ~50% interflow: ~45% precipitation: ~5% pore water at Waughop Lake. Currently we can’t distinguish between contributions from the “A” versus “C” aquifers because their waters overlap significantly in chemical as well as O/H isotopic composition. Although we have only modeled a few lakes thus far, using conservative elements appears to be a promising technique for identifying the water sources that supply a lake and for obtaining semi-quantitative estimates of their relative proportions. The elements that proved most useful for mass balance modeling in our study (Ca, Mg, Na, Cl, and SO4) are routinely included in published water analyses, which may make it possible to use literature data in many areas.
Controls on the Composition of Lake Sediment
Researchers used a ‘clamshell’ to collect and analyze surface sediment samples from eight lakes.
The discovery that water chemistry varies from one lake to the next in our study area led us to wonder whether there might also be variations in sediment chemistry. Mitchell Dodo (’17) investigated this question by collecting and analyzing surface sediment samples from eight lakes. Each lake was sampled with a clamshell at 3-5 sites (to assess intra-lake variability) and the sediment was analyzed for major elements by ICP-ES and for organic content by LOI.
The results confirm that there is significant variation in the chemical composition of sediment from these lakes (Fig. 3). Much of the variation appears to be the result of mixing between organic matter and a terrigenous component (silt and clay), but other factors that influence sediment composition include water chemistry (e.g., high Si water results in more biogenic silica in the sediment), anthropogenic nutrient loading (raises both organic content and phosphorus levels) and efforts to control algae by the application of calcium hydroxide. The data (Fig. 3) also clearly reveal that in some lakes the sediment is very homogenous, while in others it is not. In general, lakes with homogenous sediment tend to be those with higher organic content, but the reason for this correlation is not clear. Sediment homogeneity shows no obvious relationship with lake surface area or maximum depth.
The takeaway message from these studies is that even lakes that lie near each other and have similar geologic and hydrologic settings can display significant differences in water and sediment composition. These differences reflect both natural and anthropogenic processes that can be deciphered through chemical analysis. Understanding these processes sheds light on the how a lake functions and is potentially important for making wise lake management decisions.
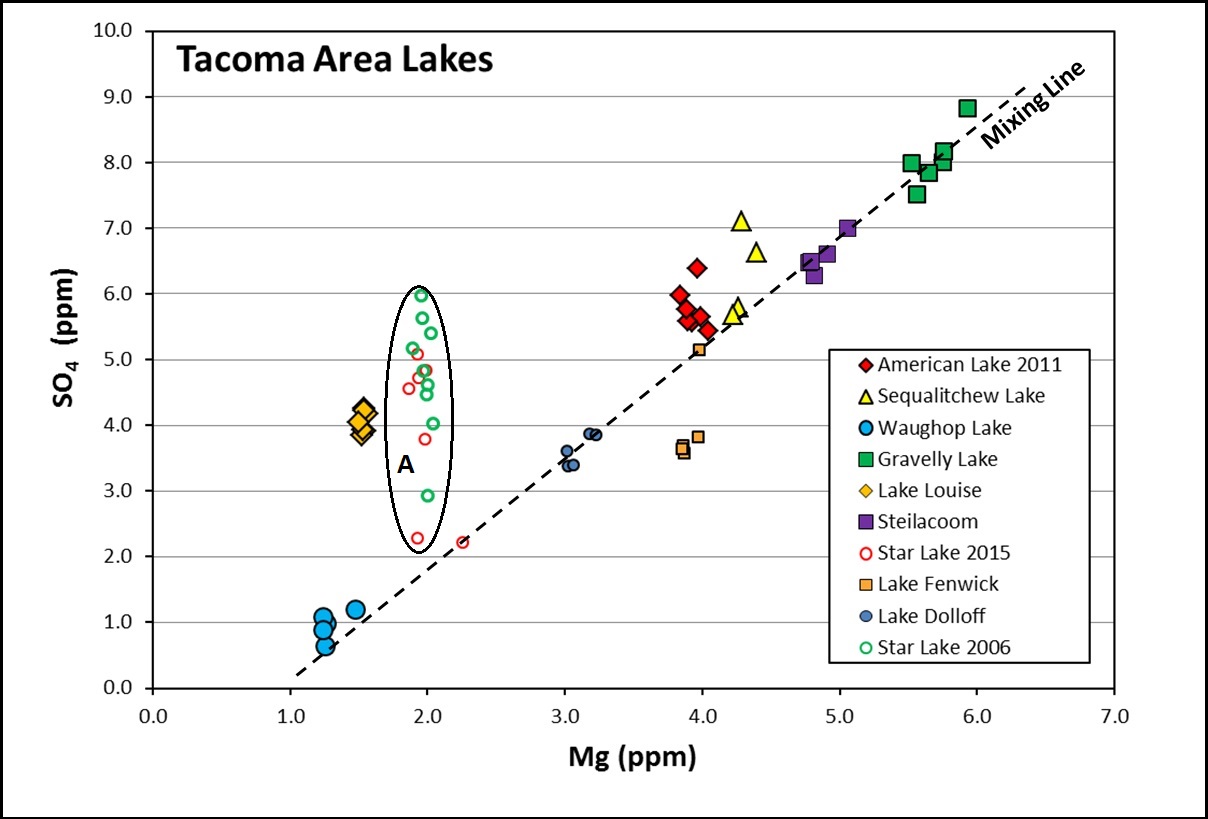
Figure 1. Sulfate vs. magnesium concentration in water from Pierce and King County lakes. Individual points for each lake represent samples from different depths collected on a date when the lake was chemically stratified. The tight clustering of data points for each lake indicates these elements were conserved in the water column. Note that data points for most lakes lie along a linear array, suggestive of a mixing line. Data that plot off the array indicate different water sources (e.g., Lake Louise) or non-conservative behavior in the water column (e.g., Star Lake in oval A).

Figure 2. Plot of chloride vs. sodium concentrations in water from South Puget Sound lakes (surface), interflow, groundwater (wells), and rain. Lake samples generally plot between the fields for rain and groundwater/interflow, consistent with the hypothesis that they represent mixtures of these sources.
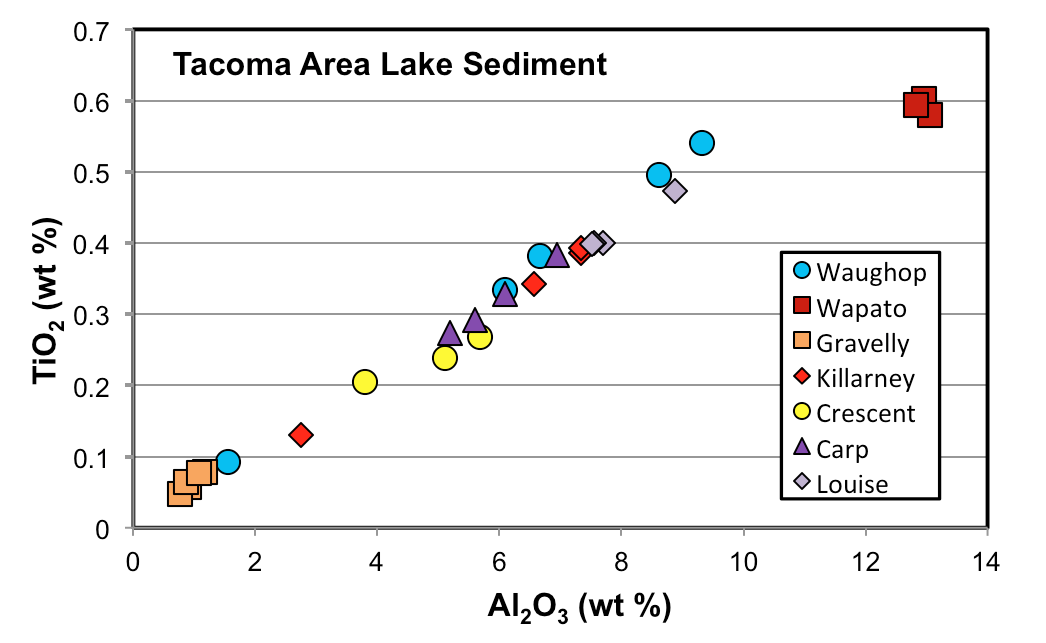
Figure 3. Variations in the chemical composition of surface sediment from Tacoma area lakes. The linear trend suggests mixing between a terrigenous component (high in TiO2 and Al2O3) and a biogenic component that is poor in these elements. Note also that in some lakes the sediment is homogenous while in others is it not.